Most of the time when I hear or read about clever angles relating to the Kentucky Derby, I pay about as much attention to them as I do to political ads around election season. In other words, I dismiss them entirely.
So, it should come as no surprise that, despite the fact I’m a big believer in pace handicapping and firmly believe that a fast finish is highly relevant to a horse’s overall success, I’ve never really focused on final fractions in Kentucky Derby prep races. Mind you, I produce my own pace figures, so, in a sense, I get the same insights.
For example, I’m well aware of the fact that horses recording a “poor” late speed ration (-15 or less) last time are just 1-for-91 in the Run for the Roses over the past 28 years. I also know that animals earning an LSR of -10 or greater in their last prep have won 21 of the last 28 editions of America’s greatest horse race (not counting last year’s COVID-tainted affair).
Still, a question from a reader prompted me to study the final fractions more closely — in search of quick and easy rules for Kentucky Derby consideration or elimination.
My quest began with Jennie Rees.
Rees is a longtime turf writer and the one who gave birth to the “Final Fractions Theory.” According to Rees, at the suggestion of trainer Phil Thomas, she did some research and found that horses finishing their final 1 1/8-mile prep in 38 seconds or less significantly outperformed those that didn’t.
Note: There have been variations of this theme dating back to Colonel E. R. Bradley in the early 1900s. Rees simply gave it a name.
“The premise is that horses who meet those parameters are more likely to be able to handle the extra eighth-mile they’ll face in the 1 1/4-mile Kentucky Derby,” Rees wrote in a 2016 column. “It also suggests that those horses are in good form and not regressing.”
Fellow turf writer J. Keeler Johnson seems to agree.
In a 2017 article for America’s Best Racing, Johnson notes that “the last five Kentucky Derby winners — and 15 of the last 20 — ran the last three-eighths of their final Derby prep race in less than 38 seconds, indicating that analyzing these fractional times can be very useful for handicapping the Kentucky Derby.”
Of course, neither Rees nor Johnson provide any statistics proving their assertions to be true (noting that 15 of 20 Derby winners finished their final prep in 38 seconds or less does not consider how many Derby losers also met this stipulation).
So, with an assist from my Kentucky Derby database, along with several mind-numbing updates and some good glue to sniff, I found the answers, which I’ve tabulated below. Before I present the data, however, there are a couple things I think readers should know.
1) I employed a mathematical formula to obtain a more precise value for a length. In his excellent piece, Johnson points out some of the issues with the standard five-lengths-per-second rule and, instead, used “the estimation that six lengths is equal to one second.” But that’s not really accurate either, as the value of a length is variable — dependent on both time and distance (not to mention the actual length of the horse in question, which is practically impossible to ascertain, unfortunately).
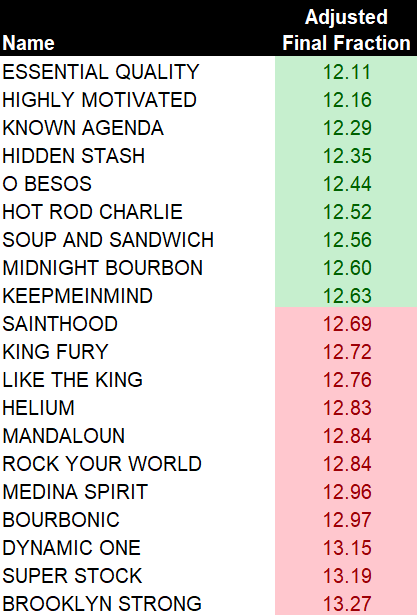
2) I converted all the final fractions to a one-furlong time. Hence a horse that ran its final 3/8-mile in 36 seconds and gained three lengths from the second call to the finish was credited with a 12-second final time and a one-length gain (which was then adjusted via the formula referenced above). This doesn’t change the final calculations in any way; it just makes it easier to compare horses that ran at different distances, e.g. horses that last competed in 1 1/16-mile races, like the Lexington Stakes (G3).
So, without any further ado, here are the numbers:
HORSES THAT FINISHED THEIR FINAL PREPS IN 12 2/3 SECONDS PER FURLONG OR LESS (since 1992)
Number: 286
Winners: 22
Win Rate: 7.7%
$2 Net: $2.36
IV: 1.42
OBIV: 1.09
HORSES THAT DIDN’T FINISH THEIR FINAL PREPS IN 12 2/3 SECONDS PER FURLONG OR LESS (since 1992)
Number: 231
Winners: 6
Win Rate: 2.6%
$2 Net: $0.85
IV: 0.47
OBIV: 0.46
NOTE: The impact value, or IV, referenced above is a measurement of the number of times a winning horse shows a particular attribute compared to the number of times other entrants show that very same attribute. An IV greater than 1.00 suggests that the attribute is positive (produces more winners than expected), while an IV less than 1.00 implies the opposite.
The odds-based impact value, or OBIV, follows a similar logic — except the final odds, rather than the number of entrants, determine each horse’s probability of visiting the winner’s circle. Because takeout and breakage are part of the final odds, a neutral OBIV (comparable to an IV of 1.00) ranges from 0.80 to 0.85 (see chart below).
Well, it looks as though Rees and Johnson are on to something: a strong last-race finish is a very positive sign for horses hoping to accessorize with roses on the first Saturday in May. On the other hand, the Final Fraction Theory has missed some great prices over the past 10 years, including back-to-back winners Mine That Bird ($103.20 in 2009) and Super Saver ($18.00 in 2010).
I still prefer my pace figures, but the data clearly suggests that there is a benefit to analyzing the raw numbers. And, hey, it’s easy enough to do, so why not? Below is a listing of this year’s top Kentucky Derby candidates and how they rank according to the Final Fraction Theory:


